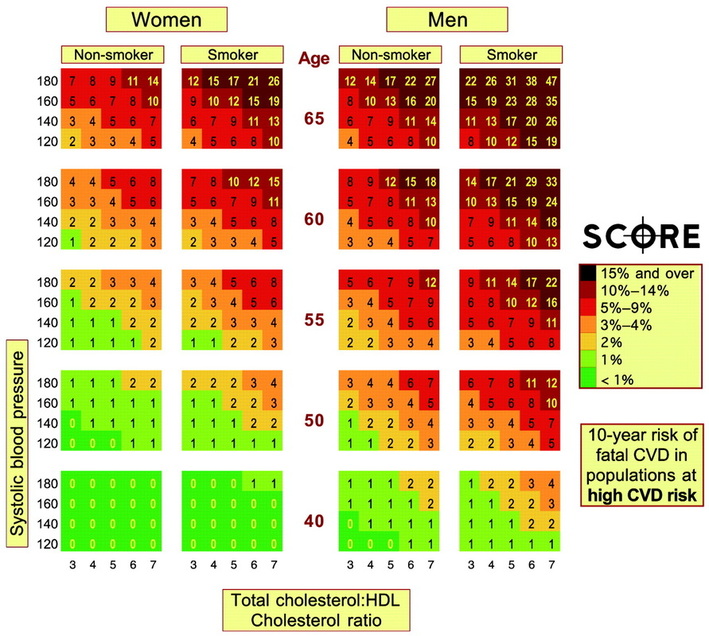
Cardiac Risk Stratification

Men have heart attacks at a higher rate.
Sometimes their risk can be predicted.
The 7th Day Adventists are a huge help.
Mostly because a lot of them live in Framingham, Massachusetts.
For reasons which are a mystery to me, Mormons congregated in St. Lake City, Utah. And a whole lot of 7th Day Adventists settled in Framingham, Massachusetts. Where they kindly volunteered to be heart disease guinea pigs.
Adventists are interesting because they are vegetarian. And so they are the "healthy eating" comparison group for the rest of the entire world. The sinful meat eaters and cholesterol addicts !
The Framingham Heart Study has studied thousands of of veggie Adventists for about three generations, and from it we can partially predict the probabilities of problematic heart hazards.
What are the odds ?
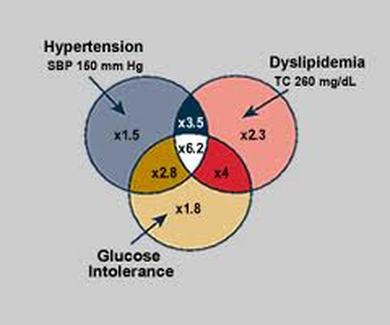
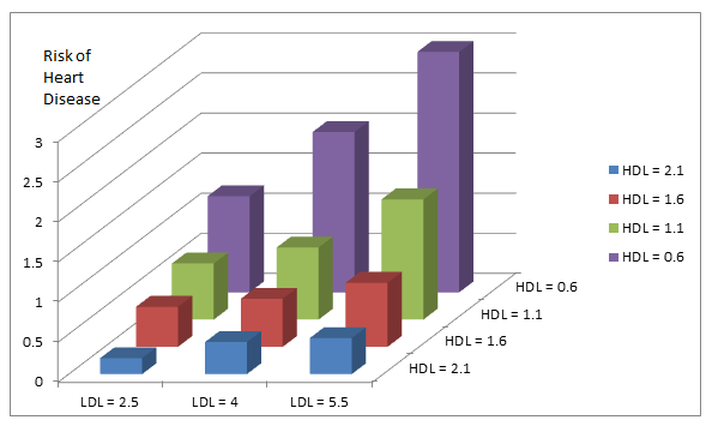
We now know that have high cholesterol, high blood pressure, and high blood sugar increase a mans heart attack risk. And now we can even do some preliminary risk calculations.
Even without cardiac "risk factors" we are at all high risk.

The risk of developing cardiovascular disease (CVD) in one's lifetime after age 45 years exceeds 60% for men and 55% for women overall, a new study suggests.
Not surprisingly, the risk is greatest in people with more CVD risk factors, the study team says. However, lifetime CVD risk still tops 30% in men and women even with an optimal risk factor profile.
Still, keeping traditional CVD risk factors at bay in midlife leads to substantially longer survival free of CVD, they found, up to 14 years longer than those with 2 risk factors.
The study appears in the November 7 issue of the Journal of the American Medical Association, a theme issue on cardiovascular disease. It was released early online November 5 to coincide with the American Heart Association's 2012 Scientific Sessions underway in Los Angeles, California.
.

No Data
Until now, there have been no published data on the lifetime risk for total CVD, John T. Wilkins, MD, from the Northwestern University Feinberg School of Medicine in Chicago, Illinois, and colleagues note in their paper. "Estimates of lifetime risk for total…CVD may provide projections of the future population burden of CVD and may assist in clinician-patient risk communication," they write.
In this study, the researchers estimated lifetime risk, as well as years lived free of total CVD (including fatal and nonfatal coronary heart disease, all forms of stroke, congestive heart failure, and other CVD deaths) using individual-level data from 5 National Heart, Lung, and Blood Institute–funded community-based cohorts: the Framingham Heart Study, Framingham Offspring Study, Atherosclerosis Risk in Communities Study, Chicago Heart Association Detection Project in Industry Study, and Cardiovascular Health Study.
The analysis included as many as 905,115 person-years of data. All participants were free of CVD at baseline.
Across all index ages (ie, 45, 55, 65, and 75 years), 1.7% to 7.9% of individuals were in the "all optimal" risk factor group: that is, those with blood pressure [BP] less than 120/80 mm Hg, total cholesterol [TC] level < 180 mg/dL, and no smoking or diabetes.
At all index ages, more than 55% of individuals were in the 1 major or at least 2 major risk factor strata, including those with a BP of 160/100 mm Hg or greater or receiving treatment, TC level of 240 mg/dL or greater or receiving treatment, diabetes mellitus, and/or current smoking.
No Guarantees
At some time during follow-up across all index age groups, approximately 30% to 35% of individuals experienced CVD events, with men at higher risk than women.
.
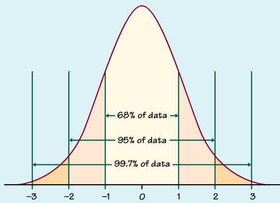
When stratified by risk factor burden, at ages 55 and 65 years, men and women with at least 1 elevated risk factor (BP 140-149/90-99 mm Hg or TC 200-239 mg/dL, but no diabetes or smoking), 1 major risk factor, or at least 2 major risk factors, had lifetime risks of CVD (to age 95 years) that exceeded 50%.
Even with an optimal risk factor profile, men and women at the index age of 55 years had a lifetime CVD risk of greater than 40% and 30%, respectively. However, for those in the optimal risk factor group in middle age, the age at onset of CVD was an average of 8 to14 years later than that of their peers with at least 2 major risk factors.
"Thus, the maintenance of optimal risk factors through ages 45, 55, and 65 years may not guarantee a life free from total CVD, but it increases the probability that more years will be lived free of CVD," the researchers note.
"In addition, for some index ages in men and women in our analyses, we observed that individuals with optimal risk factors who developed total CVD at much older ages, appeared to have a shorter post-CVD event survival, consistent with the phenomenon of compression of morbidity," posited in 1980 by Fries et al (N Engl J Med. 1980;303:130-135).
The finding of a substantial lifetime CVD risk even among individuals with an optimal risk factor profile highlights "the large public health burden and opportunities for prevention of total CVD," the authors conclude.
The study was funded by the National Heart, Lung, and Blood Institute. The authors have disclosed no relevant financial relationships.
JAMA. 2012;308:1795-1801. Published online November 5, 2012. Abstract
Polypill for heart disease prevention

The polypill will contain a cholesterol pill, one or two blood pressure pills, perhaps some Vitamin D and folic acid, and whatever else is generally good for what ails a middle aged person at risk for heart disease.
A version of the polypill is already in use in India, and another one is being developed in Australia and many other countries.
The idea is that there are a variety of medications that help modify cardiac risk factors, and that almost anyone over 50 who has cardiac risk factors could benefit from "the polypill". And it is easier than taking a lbunch of individual pills each day.
Different manufactors have different recipes for their polypill.
If I were going to make my own polypill I think I would mix it up with the following ingredients.
Dr. Pat's Polypill
Dr. Pat's Polypill

Here is what I would put in my own recipe for a polypill if I were the one choosing. But bear in mind that I don't have to deal with regulatory agencies, or make the pills up myself. Which is good, because my pill would probably be the size of a small frisbee.
ASA (aspirin ) 325 mg not the 81 mg "baby aspirin" strength usu recomended
ramipril 10 mg because it gives you HOPE ( that is an 'in' joke )
crestor 20 mg to prevent all sorts of heart disease and cancer and maybe Alzheime
fish oil 1000 mg despite some recent bad publicity it is still very good stuf
coezyme Q 10 good for everyone, but especially those on lipid drug
How bad are your risk factors ?

Activity How much your heart risk is increased
Smoking 2.87 X incr. risk for for current vs never
Raised ApoB/ApoA1 ratio 3.25 X for top vs lowest quintile
Hypertension 1.91
Diabetes 2.37
Abdominal obesity 1.3
Daily fruit and veggies 0.70 ( less than 1 means risk is decreased )
Regular moderate alcohol 0.90
Regular physical activity 0.86
Collectively these risk factors can account for 90 % of heart disease in men and women, young and old, in all regions of the world.
These risk factors are really, really bad when you have multiples of them, because they aggravate each other hugely. Therefore the risks for combinations of risk factors are hugely worse than for individual risk factors. Some of the risk factor combinations are :
Risk Increase
Combo #1) Smoking, diabetes, blood pressure 13 X
#2) " " " " , cholesterol 40 X
#3) " " " " " , obesity 70 X
#4) " " " " " " , stress 180 X
Link to the original Lancet article
How bad is the "bad cholesterol"?
CLICK ON THE PICTURE TO WATCH THE VIDEO
As a general rule the lower your bad cholesterol the better it is for you. Here is a good video expressing this general principle., from someone both smarter and prettier than I.
The cholesterol units she is using are American, rather the the S.I. Canadian version, but you should get the general message. And I will try and post a nomogram to make it easy to see what she is talking about in Canadian cholesterol units.
The cholesterol units she is using are American, rather the the S.I. Canadian version, but you should get the general message. And I will try and post a nomogram to make it easy to see what she is talking about in Canadian cholesterol units.
Converting from US to SI units for cholesterol
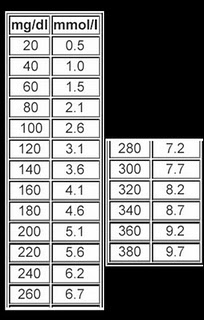
Or for those with calculators, multiply the American values by 0.026 to get the Canadian values.
Prolonged TV watching is a cardiac risk factor

British Journal of Sports Medicine
Television Viewing Time and Reduced Life Expectancy -- A Life Table Analysis
Background Prolonged television (TV) viewing time is unfavourably associated with mortality outcomes, particularly for cardiovascular disease, but the impact on life expectancy has not been quantified. The authors estimate the extent to which TV viewing time reduces life expectancy in Australia, 2008.
Methods The authors constructed a life table model that incorporates a previously reported mortality risk associated with TV time. Data were from the Australian Bureau of Statistics and the Australian Diabetes, Obesity and Lifestyle Study, a national population-based observational survey that started in 1999–2000. The authors modelled impacts of changes in population average TV viewing time on life expectancy at birth.
Results The amount of TV viewed in Australia in 2008 reduced life expectancy at birth by 1.8 years (95% uncertainty interval (UI): 8.4 days to 3.7 years) for men and 1.5 years (95% UI: 6.8 days to 3.1 years) for women.
Compared with persons who watch no TV, those who spend a lifetime average of 6 h/day watching TV can expect to live 4.8 years less. (95% UI: 11 days to 10.4 years) .
On average, every single hour of TV viewed after the age of 25 reduces the viewer's life expectancy by 21.8 min. (95% UI: 0.3–44.7). Or to put it another way, every three hours of tv watching subtracts an hour from your life.
This study is limited by the low precision with which the relationship between TV viewing time and mortality is currently known.
Conclusions TV viewing time may be associated with a loss of life that is comparable to other major chronic disease risk factors such as physical inactivity and obesity.
